Plotting Agent
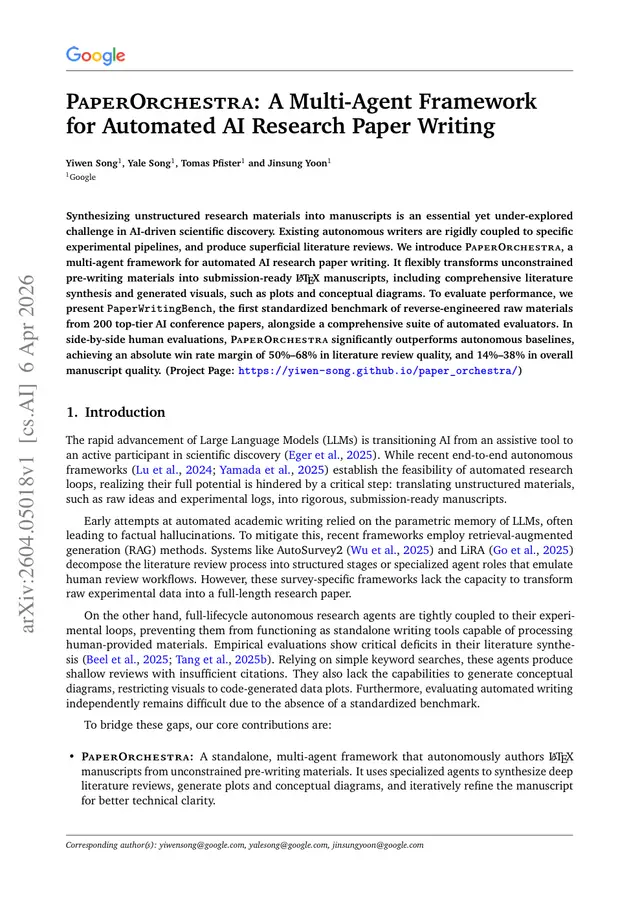
Step 2 of the PaperOrchestra pipeline (arXiv:2604.05018).
Install
npx skills add Ar9av/PaperOrchestra --skill plotting-agent -g -a claude-code -y- Repository
- Ar9av/PaperOrchestra694
- Category
- AI and agents
- Updated
- 24d ago
- License
- See repository
- Context cost
- Mediumabout 2,203 tokens
- Runs scripts
- Yes, review before use
What it does
Step 2 of the PaperOrchestra pipeline (arXiv:2604.05018). Execute the visualization plan from outline.json, render plots and conceptual diagrams from experimental_log.md and idea.md, optionally refine via VLM critique loop, and produce context-aware captions. Runs in parallel with the literature-review-agent. TRIGGER when the orchestrator delegates Step 2 or when the user asks to "generate the figures for my paper" or "render the plots from this experiment log".
Plotting Agent (Step 2)
Faithful implementation of the Plotting Agent from PaperOrchestra (Song et al., 2026, arXiv:2604.05018, §4 Step 2 and App. F.1 p.45).
Cost: ~20, 30 LLM calls. The paper uses PaperBanana (Zhu et al., 2026) as the default backbone with a closed-loop VLM-critique refinement. This skill expresses that loop in host-agent terms: you (the host agent) generate matplotlib code with your own LLM, render via your Bash/Python tool, optionally critique the rendered PNG with your vision model, redraw, and finally caption.
Inputs
workspace/outline.json, specifically theplotting_planarrayworkspace/inputs/idea.mdandworkspace/inputs/experimental_log.md, the source dataworkspace/inputs/figures/, optional pre-existing figures (PlotOnmode)
Outputs
workspace/figures/<figure_id>.png, one PNG perplotting_planentry (300 DPI, sized to the requested aspect ratio)workspace/figures/captions.json,{figure_id: caption_text}map
Workflow
Per figure (executed independently per figure_id)
-
Read the figure spec from
outline.json:{ "figure_id": "fig_main_results", "title": "Main Results on Dataset X", "plot_type": "plot", "data_source": "experimental_log.md", "objective": "Visual summary (Grouped Bar Chart) demonstrating ...", "aspect_ratio": "5:4" } -
Few-shot retrieval (visual planning): pick the matching pattern from
references/chart-patterns.md(forplot_type=="plot") orreferences/diagram-patterns.md(forplot_type=="diagram"). -
Extract data: parse
idea.mdand/orexperimental_log.md(data_sourcefield tells you which) to obtain the numeric values or conceptual entities the figure needs. Forexperimental_log.md, the## 2. Raw Numeric Datasection contains markdown tables. -
Render: