Live Watch
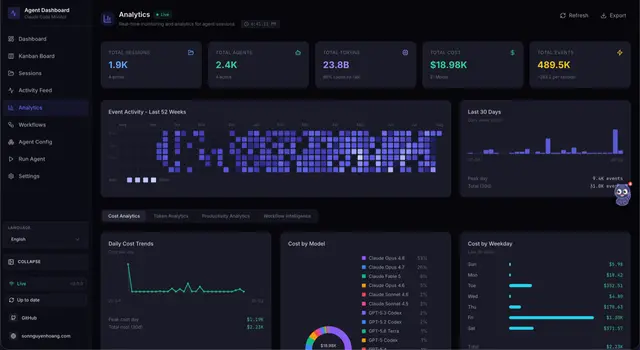
Polls the Agent Monitor /api/stats endpoint several times over a short window and...
Install
npx skills add hoangsonww/Claude-Code-Agent-Monitor --skill live-watch -g -a claude-code -y- Repository
- hoangsonww/Claude-Code-Agent-Monitor1.1k
- Category
- AI and agents
- Updated
- 5d ago
- License
- MIT
- Context cost
- Lightabout 521 tokens
- Runs scripts
- No, instructions only
What it does
Polls the Agent Monitor /api/stats endpoint several times over a short window and reports the live deltas in active_sessions, active_agents, events_today, and ws_connections so you can see activity moving in real time. Use when watching the dashboard for live changes rather than a one-time snapshot.
Live Watch
Watch the dashboard's live counters change over a short window by polling
/api/stats a few times and reporting the deltas.
Input
The user provides: $ARGUMENTS
Interpreted as the watch shape: number of polls and/or interval (e.g. 5x3s =
5 samples 3 seconds apart). Defaults when empty: 5 samples, ~3 seconds apart
(a ~15-second window). A bare number means that many samples at the default
interval; a bare duration means the default sample count at that interval.
Data Sources
| Endpoint | Returns |
|---|---|
GET /api/stats (polled) | { total_sessions, active_sessions, active_agents, total_agents, total_events, events_today, ws_connections, agents_by_status, sessions_by_status } |
Method
Poll GET /api/stats once per interval for the configured number of samples,
recording the timestamp and the four watched counters each time. Pace the polls
with a short wait between requests; keep the total window short (seconds, not
minutes) so it stays interactive.
If the very first poll fails to connect, the dashboard is down, stop and tell
the user to start it with npm start (or npm run dev) from the repo root,
then retry.
Report Sections
1. Watch Window
State the sample count, interval, and total elapsed window.
2. Sample Timeline
A Markdown table, one row per poll, with columns:
#, time, active_sessions, active_agents, events_today, ws_connections.
3. Deltas
For each of the four watched counters, report the net change from the first to
the last sample using ▲ (increase), ▼ (decrease), or = (no change). Note any
mid-window spikes or dips visible in the timeline.
4. Verdict
One line: is the dashboard actively receiving traffic (counters moving) or idle (flat) over the window?