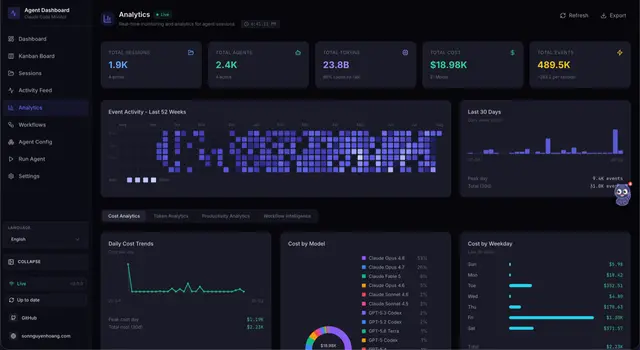
Spend Forecast
Forecast Claude Code spend to the end of the week or month from the daily session trend...
Install
npx skills add hoangsonww/Claude-Code-Agent-Monitor --skill spend-forecast -g -a claude-code -y- Repository
- hoangsonww/Claude-Code-Agent-Monitor1.1k
- Category
- AI and agents
- Updated
- 5d ago
- License
- MIT
- Context cost
- Lightabout 802 tokens
- Runs scripts
- No, instructions only
What it does
Forecast Claude Code spend to the end of the week or month from the daily session trend on the Agent Monitor dashboard, moving average of daily spend × days remaining, added to spend-to-date. Uses /api/analytics daily_sessions, /api/pricing/cost, and /api/sessions for a per-day cost curve. Use when projecting cost or asking "where will my spend land".
Spend Forecast
Project where Claude Code spend will end up by the close of the current week or month.
Input
The user provides: $ARGUMENTS
This is the forecast horizon, "week", "month", or a specific date. Default to
month (calendar month-end) when nothing is given, and state the horizon you used.
Data Sources
| Endpoint | Returns |
|---|---|
GET /api/analytics | { total_cost, tokens (effective totals, baselines pre-summed), daily_sessions (365d: [{ date, count }]), daily_events, overview, ... }, daily_sessions is the trend the forecast extrapolates |
GET /api/pricing/cost | { total_cost, breakdown: [{ model, input_tokens, output_tokens, cache_read_tokens, cache_write_tokens, cost, matched_rule }] }, authoritative spend-to-date and avg cost-per-session input |
GET /api/sessions?limit=200 | Session list with inline cost and started_at, group by day for a sharper daily-spend curve than the count-based approximation |
Forecast method
Spend has no native per-day field, so build a daily-spend series and extrapolate:
- Spend-to-date =
total_costfrom/api/pricing/cost. - Avg cost per session =
total_cost / total_session_count. - Daily spend series: for the trailing window,
daily_spend[d] ≈ daily_sessions[d].count × avg_cost_per_session. For a sharper curve, instead sum inline sessioncostgrouped byDATE(started_at). - Moving average:
avg_daily_spend = mean(daily_spend over the trailing 7 days). Also compute a 14-day average to gauge whether the trend is accelerating (▲) or cooling (▼). - Remaining days: days left until the end of the chosen horizon (week = through Sunday; month = through the last calendar day).
- Projection:
projected_total = spend_to_date_this_period + (avg_daily_spend × days_remaining).