Usage Trends
Analyze Claude Code usage trends over time using the Agent Monitor's analytics API, ...
Install
npx skills add hoangsonww/Claude-Code-Agent-Monitor --skill usage-trends -g -a claude-code -y- Repository
- hoangsonww/Claude-Code-Agent-Monitor1.1k
- Category
- AI and agents
- Updated
- 5d ago
- License
- MIT
- Context cost
- Lightabout 765 tokens
- Runs scripts
- No, instructions only
What it does
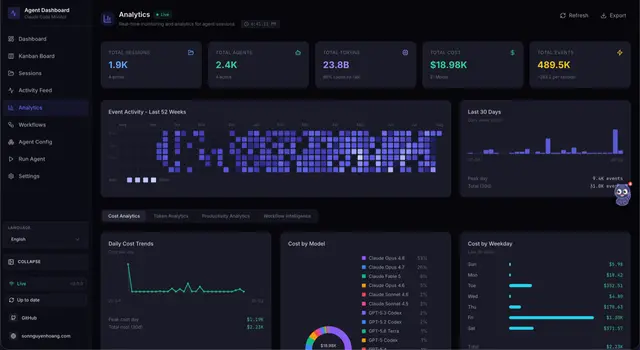
Analyze Claude Code usage trends over time using the Agent Monitor's analytics API, daily session counts, daily event counts, token volumes by type, model distribution, tool usage rankings, and agent/event type distributions across 365-day retention windows.
Usage Trends
Analyze usage patterns and trends from the Agent Monitor analytics data.
Input
The user provides: $ARGUMENTS
Options: "last 7 days", "last 30 days", "last quarter", "peak hours", "tool trends", "model usage".
Data Sources
| Endpoint | Returns |
|---|---|
GET /api/analytics | Comprehensive analytics object (see schema below) |
GET /api/stats | { total_sessions, active_sessions, active_agents, total_agents, total_events, events_today, ws_connections, agents_by_status, sessions_by_status } |
GET /api/sessions?limit=200 | Full session records with timestamps and metadata |
Analytics response schema (GET /api/analytics)
{
  "overview": { "total_sessions", "active_sessions", "active_agents", "total_agents", "total_events" },
  "tokens": {
    "total_input": N, "total_output": N,
    "total_cache_read": N, "total_cache_write": N
  },
  "tool_usage": [{ "tool_name": "...", "count": N }],  // top 20
  "daily_events": [{ "date": "YYYY-MM-DD", "count": N }],  // 365 days
  "daily_sessions": [{ "date": "YYYY-MM-DD", "count": N }],  // 365 days
  "agent_types": [{ "subagent_type": "task"|"explore"|null, "count": N }],
  "event_types": [{ "event_type": "PreToolUse"|"PostToolUse"|..., "count": N }],
  "avg_events_per_session": N,
  "total_subagents": N,
  "sessions_by_status": { "active": N, "completed": N, "error": N, "abandoned": N },
  "agents_by_status": { "working": N, "completed": N, "error": N, ... }
}
Trend Analyses to Produce
1. Daily Activity Trend
Plot daily_sessions and daily_events for the requested period. Compute:
- Average sessions/day and events/day
- Week-over-week delta (%)
- Peak day and quietest day