Plot From Image
Reproduce any academic paper figure from an uploaded image using accumulated style...
Install
npx skills add Trae1ounG/paper-plot-skills --skill plot-from-image -g -a claude-code -y- Repository
- Trae1ounG/paper-plot-skills936
- Category
- Media
- Updated
- 7mo ago
- License
- See repository
- Context cost
- Lightabout 726 tokens
- Runs scripts
- Yes, review before use
What it does
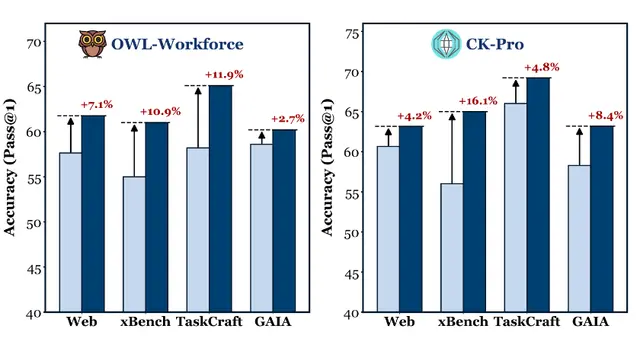
Reproduce any academic paper figure from an uploaded image using accumulated style experience. Use when: user uploads/attaches a paper figure and asks to reproduce or recreate it; user says "复现这个图", "reproduce this plot", "match this figure", "照着这个图画"; or user provides a paper figure PNG/screenshot and wants Python matplotlib code that generates it. Includes analysis workflow for font detection, color extraction, proportion matching, and mapping to 8 pre-built styles or creating a new style from scratch.
Plot From Image
Reproduce a paper figure by analyzing the image and leveraging accumulated style knowledge.
Workflow
1. Measure Proportions
python3 -c "from PIL import Image; img=Image.open('fig.png'); print(img.size, f'AR={img.size[0]/img.size[1]:.2f}')"
Set figsize=(FW, FH) so FW/FH matches the original AR exactly.
2. Match to Existing Style
Check if the figure matches a pre-built style (fastest path):
| Figure type | Check for |
|---|---|
| Grouped/paired bar | bar_paired_delta or bar_grouped_hatch |
| Line with shaded bands | line_confidence_band |
| Line with cut lines or reference | line_training_curve |
| Loss curve + zoom panel | line_loss_with_inset |
| Scattered clusters | scatter_tsne_cluster |
| Broken x-axis | scatter_broken_axis |
| Polygon web chart | radar_dual_series |
If matched → read ../plot-from-data/references/<name>.md for exact parameters → adapt ../plot-from-data/scripts/<script>.py.
3. If No Match → Analyze From Scratch
Read references/reproduction_guide.md for the full analysis checklist covering:
- Font family detection (serif vs sans-serif, LaTeX vs not)
- Spine & tick style (L-shape, 4-sided, arrows, in/out direction)
- Color identification (tab10 vs custom)
- Grid style (dashed, dotted, none)
- Special elements (insets, broken axes, radar grids, annotation boxes)
4. Build & Iterate
Write script → python3 <script>.py → visually compare → fix proportions/colors → re-run
Key iteration checklist:
- AR matches original (measure with PIL)
- Font family correct (serif for LaTeX papers, sans-serif for system fonts)
- Colors within ±10 RGB of original
- Spine style matches (L vs 4-sided)
- Tick direction matches (in vs out)
- Grid style matches
- Legend placement matches
- Annotations/labels position matches
Accumulated Experience
From 9 reproduced figures across 7 papers, key lessons: